Complete OHLCVT Data for Every Trading Pair

Kraken provides one of the most comprehensive and well-structured free public datasets for historical crypto price data. Their archives include intraday OHLCVT files (Open, High, Low, Close, Volume, Trades) for every trading pair, available across multiple time intervals:
- 1 minute
- 5 minute
- 15 minute
- 30 minute
- 1 hour
- 4 hour
- 12 hour
- 24 hour
In this article you will learn:
- Where to manually download the full Kraken historical archives
- Where to access Kraken’s quarterly update files
- How to merge all raw files into a single clean dataset
- How to automatically download Binance data for comparison
- How to use Binance data to verify and cross-check Kraken pricing
- A ready to run Python script that automates the merging and validation
Some of the downloadable files are extremely large (exceeding 7 GB), which often causes automated scripts to be blocked by Google Drive. Consequently, the files need to be downloaded manually, but the merging stage is fully automated.
Important note
This source cannot be used for a survivorship bias free database. It only includes active or recently active Kraken markets, while delisted, dead and short lived assets are removed from the API and never appear in the dataset.
Need a complete solution
If you need a full survivorship bias free dataset that
includes live, delisted, migrated and dead assets, see our
guide:
Building a Survivorship Bias-Free Crypto Dataset with the CoinMarketCap API
Full Code (Google Colab)
You can access the full Python code directly in the Colab notebook. The scripts run out of the box, but you need to manually download the Kraken data archives and place them in your working directory before running the merge steps.
Open Colab Notebook1. Download the Full Kraken Historical OHLCVT Dataset
Kraken provides the entire historical dataset (from market inception to Q3 2024) as a single ZIP file.
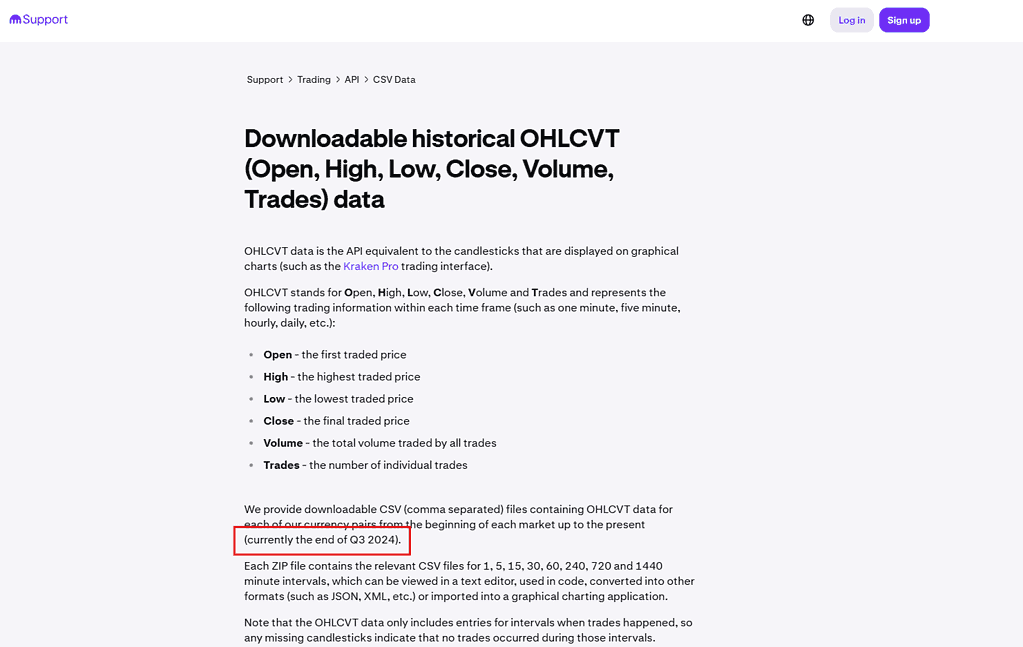
Full history (up to Q3 2024)
You can download the complete Kraken OHLCVT archive here:
https://drive.google.com/file/d/1ptNqWYidLkhb2VAKuLCxmp2OXEfGO-AP/view
After downloading, save the file as:
Kraken_OHLCVT.zip
The archive is several gigabytes in size, so the download may take some time.
2. Download the Quarterly Update Files (Q4 2024 to Q4 2025)
Download each update manually and place them in the same folder.
Quarterly updates
These quarterly archives include all new Kraken OHLCVT data published after the main history file.
At this point, you should have the following files in your dataset folder:
Kraken_OHLCVT.zip
Kraken_OHLCVT_Q4_2024.zip
Kraken_OHLCVT_Q1_2025.zip
Kraken_OHLCVT_Q2_2025.zip
Kraken_OHLCVT_Q3_2025.zip
Kraken_OHLCVT_Q4_2025.zip3. How the Data Is Organized Inside Each ZIP
Each ZIP contains multiple CSV files, one for every trading pair and every interval.
Examples:
XBTUSD_1.csv       → BTC/USD 1 minute candles
XBTUSD_5.csv       → BTC/USD 5 minute candles
ETHUSD_1.csv       → ETH/USD 1 minute candles
ADAEUR_1440.csv → ADA/EUR 1 day candlesYou can extract any pair and any interval simply by selecting the correct filename.
4. How to Build a Complete Historical Dataset
After manually downloading the ZIP archives, you can merge all files into a single unified dataset using the Python script shown below.
In this example, the script builds:
- 1-minute BTC/USD candles (
XBTUSD_1.csv) - Covering the entire period from 2013 through Q4 2025
You can easily modify the script to generate any symbol or timeframe you need.
import os
import zipfile
import pandas as pd

# Automatically detect the folder where this script is located
BASE_DIR = os.path.dirname(os.path.abspath(__file__))

ZIP_FILES = [
    "Kraken_OHLCVT.zip",
    "Kraken_OHLCVT_Q4_2024.zip",
    "Kraken_OHLCVT_Q1_2025.zip",
    "Kraken_OHLCVT_Q2_2025.zip",
    "Kraken_OHLCVT_Q3_2025.zip",
    "Kraken_OHLCVT_Q4_2025.zip",
]

TARGET_FILENAME = "XBTUSD_1.csv"
OUTPUT_FILE = "XBTUSD_1M_FULL.csv"

dfs = []

def is_nested_zip(zip_file):
    for name in zip_file.namelist():
        if "/" in name:
            return True
    return False

for zip_name in ZIP_FILES:
    zip_path = os.path.join(BASE_DIR, zip_name)

    if not os.path.exists(zip_path):
        print(f"Skipping (not found): {zip_path}")
        continue

    print(f"\nScanning ZIP: {zip_name}")

    with zipfile.ZipFile(zip_path, 'r') as zf:

        nested = is_nested_zip(zf)

        if nested:
            print("Detected nested ZIP structure")

            candidates = [
                name for name in zf.namelist()
                if name.endswith(TARGET_FILENAME)
            ]

            if not candidates:
                print(f"  WARNING: No {TARGET_FILENAME} found in nested ZIP")
                continue

            chosen = sorted(candidates)[-1]
            print(f"  Using file: {chosen}")

            with zf.open(chosen) as f:
                df = pd.read_csv(f, header=None)
                df.columns = ["timestamp", "open", "high", "low", "close", "volume", "trades"]
                dfs.append(df)

        else:
            if TARGET_FILENAME in zf.namelist():
                print(f"  Using file: {TARGET_FILENAME}")

                with zf.open(TARGET_FILENAME) as f:
                    df = pd.read_csv(f, header=None)
                    df.columns = ["timestamp", "open", "high", "low", "close", "volume", "trades"]
                    dfs.append(df)
            else:
                print(f"  WARNING: {TARGET_FILENAME} not found in flat ZIP")

if not dfs:
    raise ValueError(f"No '{TARGET_FILENAME}' files found in any ZIP files.")

full = pd.concat(dfs, ignore_index=True)
full = full.sort_values("timestamp").drop_duplicates("timestamp").reset_index(drop=True)

output_path = os.path.join(BASE_DIR, OUTPUT_FILE)
full.to_csv(output_path, index=False)

print(f"\nSaved merged dataset: {output_path}")
print(f"Total rows: {len(full)}")
Final Output
You will get a single CSV file that looks like:
timestamp,open,high,low,close,volume,trades
1381095240,122.0,122.0,122.0,122.0,0.1,1
...This file contains:
- Complete 1 minute BTCUSD data
- From 2013 to Q4 2025
- Clean and sorted
- Ready for analysis or backtesting
5. Verifying Your Data With Another Provider
A key part of any serious quantitative research workflow is verifying the data you rely on. Without validation, even small inconsistencies can lead to inaccurate results or models that behave differently in live trading.
No single dataset is perfect. Differences can occur for many reasons, including exchange-level outages, maintenance windows, data export quirks, or file-format inconsistencies. For this reason, it is good practice to compare multiple independent data sources to confirm that prices and timestamps align as expected.
In this section, we will download the 1-minute Bitcoin dataset from Binance, merge it into a clean file, and compare it against the Kraken series. This provides an additional layer of confidence that both datasets are consistent and free of major discrepancies.
6. Download and Build the Binance BTCUSDT 1 Minute Dataset
Binance provides historical OHLC data through the official Binance Vision S3 storage bucket. The data is split by month, so we need to fetch the directory listing, download all ZIP files, extract them, and merge them into a single dataset.
Binance historical data
Binance offers free access to its historical market data through the official public archive:
https://data.binance.vision/
The archive contains monthly compressed files for every trading pair and interval,
including the 1 minute BTCUSDT dataset. These files are stored in an Amazon S3 bucket,
which makes automated downloading possible.
https://s3-ap-northeast-1.amazonaws.com/data.binance.vision
https://data.binance.vision/data/spot/monthly/klines/BTCUSDT/1m/
You can download files manually, or use the predictable URL structure to automate the process for any symbol, interval, or date range.
Below is the full ready to run script. It will generate a complete BTCUSDT 1 minute dataset with all available history.
import os
import requests
import zipfile
import xml.etree.ElementTree as ET
import pandas as pd

# -------------------------------------------------------
# CONFIGURATION
# -------------------------------------------------------

S3_URL = "https://s3-ap-northeast-1.amazonaws.com/data.binance.vision"
LIST_URL = S3_URL + "?delimiter=/&prefix=data/spot/monthly/klines/BTCUSDT/1m/"
BASE_FILE_URL = "https://data.binance.vision/"

DOWNLOAD_DIR = "binance_raw"
EXTRACT_DIR = "binance_extracted"
OUTPUT_FILE = "BTCUSDT_1m_FULL.csv"

# Valid timestamp range (in milliseconds)
MIN_VALID_DATE = "2017-01-01"
MAX_VALID_DATE = "2030-01-01"
MIN_VALID_MS = int(pd.Timestamp(MIN_VALID_DATE).timestamp() * 1000)
MAX_VALID_MS = int(pd.Timestamp(MAX_VALID_DATE).timestamp() * 1000)

os.makedirs(DOWNLOAD_DIR, exist_ok=True)
os.makedirs(EXTRACT_DIR, exist_ok=True)

# -------------------------------------------------------
# STEP 1: Fetch list of available ZIP files
# -------------------------------------------------------

print("Fetching file list from Binance...")

response = requests.get(LIST_URL)
root = ET.fromstring(response.text)
namespace = {"ns": "http://s3.amazonaws.com/doc/2006-03-01/"}

zip_files = []
for content in root.findall(".//ns:Contents", namespace):
    key = content.find("ns:Key", namespace).text
    if key.endswith(".zip") and not key.endswith(".CHECKSUM"):
        zip_files.append(key)

print(f"Found {len(zip_files)} ZIP files.")

# -------------------------------------------------------
# STEP 2: Download ZIP files
# -------------------------------------------------------

for key in zip_files:
    filename = key.split("/")[-1]
    path = os.path.join(DOWNLOAD_DIR, filename)

    if os.path.exists(path):
        print(f"[SKIP] {filename}")
        continue

    print(f"Downloading: {filename}")
    data = requests.get(BASE_FILE_URL + key).content
    with open(path, "wb") as f:
        f.write(data)

# -------------------------------------------------------
# STEP 3: Extract and fix timestamp issues
# -------------------------------------------------------

print("\nExtracting and validating files...\n")

valid_csvs = []

for zname in os.listdir(DOWNLOAD_DIR):
    if not zname.endswith(".zip"):
        continue

    zip_path = os.path.join(DOWNLOAD_DIR, zname)

    with zipfile.ZipFile(zip_path, "r") as z:
        csv_names = [n for n in z.namelist() if n.endswith(".csv")]

        if not csv_names:
            print(f"[SKIP] {zname}: no CSV inside")
            continue

        csv_name = csv_names[0]
        out_path = os.path.join(EXTRACT_DIR, csv_name)

        z.extract(csv_name, EXTRACT_DIR)
        df = pd.read_csv(out_path, header=None)

        if df.empty:
            print(f"[EMPTY] {csv_name}")
            continue

        # Binance 2025+ files have timestamps in microseconds instead of milliseconds.
        # We detect this by checking if timestamps exceed our max valid date.
        open_time = df[0]
        close_time = df[6]

        if (open_time > MAX_VALID_MS).any():
            print(f"[FIX] {csv_name}: converting microseconds to milliseconds")
            df[0] = open_time // 1000
            df[6] = close_time // 1000
        else:
            print(f"[OK] {csv_name}")

        # Validate timestamp range
        if (df[0] < MIN_VALID_MS).any() or (df[0] > MAX_VALID_MS).any():
            print(f"[INVALID] {csv_name}: timestamps out of range, skipping")
            continue

        df.to_csv(out_path, index=False, header=False)
        valid_csvs.append(out_path)

# -------------------------------------------------------
# STEP 4: Merge all valid files
# -------------------------------------------------------

print("\nMerging files...\n")

dfs = []
for csv_path in valid_csvs:
    df = pd.read_csv(csv_path, header=None)
    df.columns = [
        "open_time", "open", "high", "low", "close", "volume",
        "close_time", "quote_volume", "trade_count",
        "taker_buy_base", "taker_buy_quote", "ignore"
    ]
    dfs.append(df)

full = pd.concat(dfs, ignore_index=True)
full = full.sort_values("open_time").reset_index(drop=True)
full.to_csv(OUTPUT_FILE, index=False)

print("=" * 50)
print(f"Done! Merged {len(valid_csvs)} files.")
print(f"Output: {OUTPUT_FILE}")
print("=" * 50)
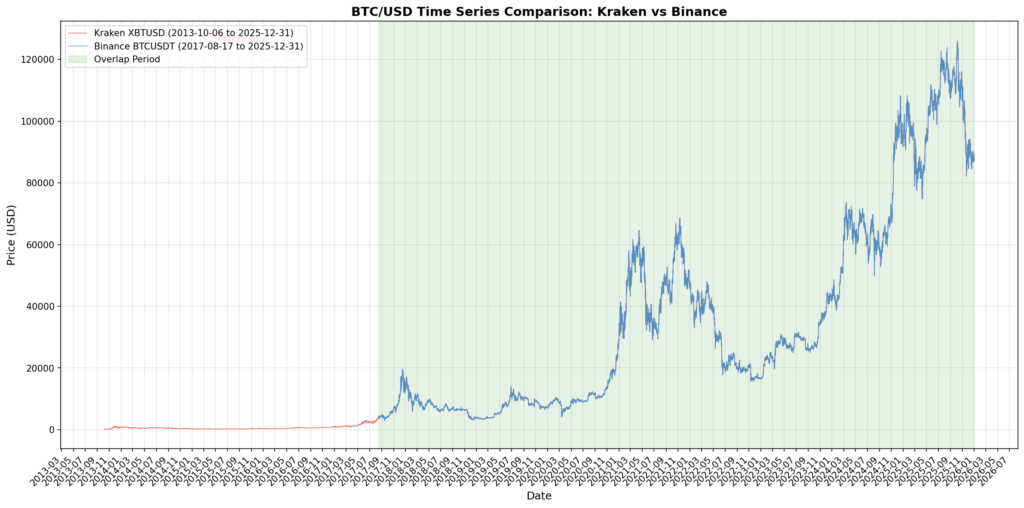
7. Compare Binance and Kraken Data to Validate Correctness
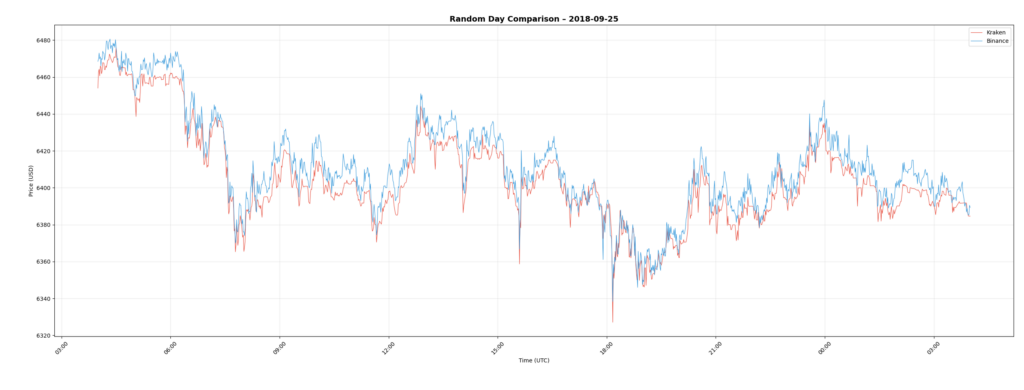
Once we have both datasets, the next step is to visually check if the price series match in the overlap period. If the data from both exchanges aligns, you can be more confident that the dataset is correct. If the lines diverge significantly, it usually means at least one data source has a problem.
Below is the comparison script. It loads both datasets, converts them to datetime, resamples to hourly for cleaner visualization, and plots the Kraken and Binance prices together.
Trading pair details
This comparison uses XBT/USD from Kraken and BTC/USDT from Binance. Although both represent Bitcoin, the quote currencies (USD and USDT) differ, which naturally introduces some spread between the two price series.
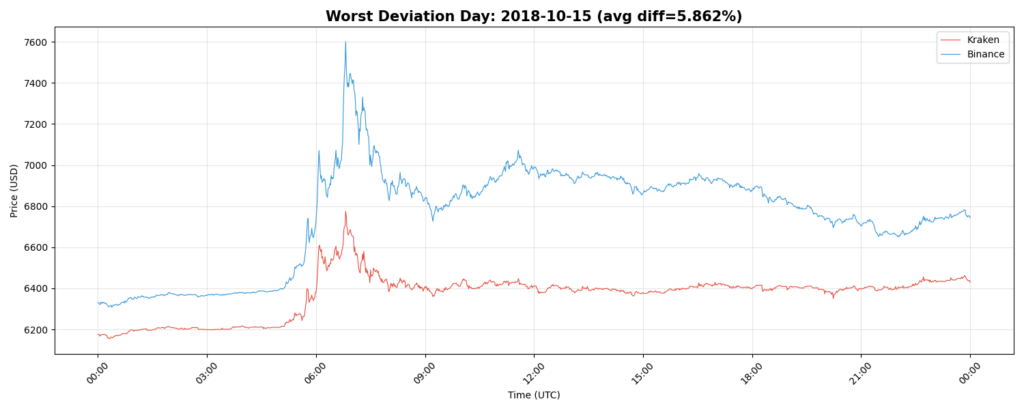
The goal of this analysis is not to determine which price is “correct.” It is to observe how closely the two markets track each other and identify periods where they diverge significantly, such as the spike seen on 2018-10-15.
import pandas as pd
import matplotlib.pyplot as plt
import matplotlib.dates as mdates
import numpy as np
import random


print("Loading Kraken data...")
kraken = pd.read_csv("XBTUSD_1M_FULL.csv")
kraken["datetime"] = pd.to_datetime(kraken["timestamp"], unit="s")
kraken = kraken.sort_values("datetime").reset_index(drop=True)

print("Loading Binance data...")
binance = pd.read_csv("BTCUSDT_1m_FULL.csv")

# Clean invalid timestamps
min_valid_ts = pd.Timestamp("2017-01-01").value // 10**6
max_valid_ts = pd.Timestamp("2030-01-01").value // 10**6
binance = binance[(binance["open_time"] >= min_valid_ts) & (binance["open_time"] <= max_valid_ts)]
binance["datetime"] = pd.to_datetime(binance["open_time"], unit="ms")
binance = binance.sort_values("datetime").reset_index(drop=True)


print("Resampling to hourly for cleaner plot...")

kraken_hourly = kraken.set_index("datetime").resample("H").agg({
    "close": "last",
    "volume": "sum"
}).dropna()

binance_hourly = binance.set_index("datetime").resample("H").agg({
    "close": "last",
    "volume": "sum"
}).dropna()

# -------------------------------------------------------
# FULL SERIES PLOT
# -------------------------------------------------------

fig, ax = plt.subplots(figsize=(16, 8))

ax.plot(
    kraken_hourly.index, kraken_hourly["close"],
    label=f"Kraken XBTUSD ({kraken_hourly.index.min().strftime('%Y-%m-%d')} → {kraken_hourly.index.max().strftime('%Y-%m-%d')})",
    color="#E74C3C", alpha=0.8, linewidth=0.8
)

ax.plot(
    binance_hourly.index, binance_hourly["close"],
    label=f"Binance BTCUSDT ({binance_hourly.index.min().strftime('%Y-%m-%d')} → {binance_hourly.index.max().strftime('%Y-%m-%d')})",
    color="#3498DB", alpha=0.8, linewidth=0.8
)

overlap_start = max(kraken_hourly.index.min(), binance_hourly.index.min())
overlap_end   = min(kraken_hourly.index.max(), binance_hourly.index.max())

ax.axvspan(overlap_start, overlap_end, alpha=0.10, color="green", label="Overlap Period")

ax.set_title("BTC/USD Full-History Comparison – Kraken vs Binance", fontsize=15, fontweight="bold")
ax.set_xlabel("Date")
ax.set_ylabel("Price (USD)")
ax.grid(True, alpha=0.3)
ax.legend(fontsize=10)

ax.xaxis.set_major_formatter(mdates.DateFormatter('%Y-%m'))
ax.xaxis.set_major_locator(mdates.MonthLocator(interval=2))
plt.setp(ax.xaxis.get_majorticklabels(), rotation=45)

plt.tight_layout()
plt.savefig("overlap_full_history.png", dpi=150)
print("\nSaved: overlap_full_history.png")
plt.show()

print(f"\nKraken range:  {kraken_hourly.index.min()} → {kraken_hourly.index.max()}")
print(f"Binance range: {binance_hourly.index.min()} → {binance_hourly.index.max()}")
print(f"Overlap:       {overlap_start} → {overlap_end}")

# -------------------------------------------------------
# RANDOM DAY COMPARISON
# -------------------------------------------------------

overlap_days = pd.date_range(overlap_start, overlap_end, freq="D")
random_days = random.sample(list(overlap_days), 3)

print("\nRandom days selected for comparison:")
for d in random_days:
    print(" →", d.date())

kraken_1m = kraken.set_index("datetime")
binance_1m = binance.set_index("datetime")

# -------------------------------------------------------
# PLOT RANDOM DAYS
# -------------------------------------------------------

for day in random_days:
    start = pd.Timestamp(day)
    end   = start + pd.Timedelta(days=1)

    k_slice = kraken_1m.loc[start:end]
    b_slice = binance_1m.loc[start:end]

    fig, ax = plt.subplots(figsize=(15, 6))

    ax.plot(k_slice.index, k_slice["close"], label="Kraken", color="#E74C3C", linewidth=0.8)
    ax.plot(b_slice.index, b_slice["close"], label="Binance", color="#3498DB", linewidth=0.8)

    ax.set_title(f"Random Day Comparison – {start.date()}", fontsize=14, fontweight="bold")
    ax.set_xlabel("Time (UTC)")
    ax.set_ylabel("Price (USD)")
    ax.grid(True, alpha=0.3)
    ax.legend()

    ax.xaxis.set_major_formatter(mdates.DateFormatter('%H:%M'))
    plt.setp(ax.xaxis.get_majorticklabels(), rotation=45)

    plt.tight_layout()
    filename = f"random_day_overlap_{start.date()}.png"
    plt.savefig(filename, dpi=150)
    print(f"Saved: {filename}")

    plt.show()

# -------------------------------------------------------
# FIND DAYS WITH THE LARGEST DIFFERENCE
# -------------------------------------------------------

print("\nComputing daily deviation between Kraken and Binance...")

k_close = kraken_1m[["close"]].rename(columns={"close": "kraken_close"})
b_close = binance_1m[["close"]].rename(columns={"close": "binance_close"})

aligned = k_close.join(b_close, how="inner")

aligned["pct_diff"] = (aligned["kraken_close"] - aligned["binance_close"]).abs() / aligned["binance_close"]

daily_diff = aligned["pct_diff"].groupby(aligned.index.date).mean()

worst_days = daily_diff.sort_values(ascending=False).head(5)

print("\nTop 5 days with largest Kraken–Binance deviation:")
print(worst_days)

# -------------------------------------------------------
# PLOT WORST MISMATCH DAYS
# -------------------------------------------------------


for day, diff in worst_days.items():
    start = pd.Timestamp(day)
    end = start + pd.Timedelta(days=1)

    k_slice = kraken_1m.loc[start:end]
    b_slice = binance_1m.loc[start:end]

    fig, ax = plt.subplots(figsize=(15, 6))

    ax.plot(k_slice.index, k_slice["close"], label="Kraken", color="#E74C3C", linewidth=0.8)
    ax.plot(b_slice.index, b_slice["close"], label="Binance", color="#3498DB", linewidth=0.8)

    ax.set_title(
        f"Worst Deviation Day: {start.date()} (avg diff={diff*100:.3f}%)",
        fontsize=15, fontweight="bold"
    )
    ax.set_xlabel("Time (UTC)")
    ax.set_ylabel("Price (USD)")
    ax.grid(True, alpha=0.3)
    ax.legend()

    ax.xaxis.set_major_formatter(mdates.DateFormatter('%H:%M'))
    plt.setp(ax.xaxis.get_majorticklabels(), rotation=45)

    plt.tight_layout()
    filename = f"worst_day_overlap_{start.date()}.png"
    plt.savefig(filename, dpi=150)
    print(f"Saved: {filename}")

    plt.show()
Full Time Series Comparison
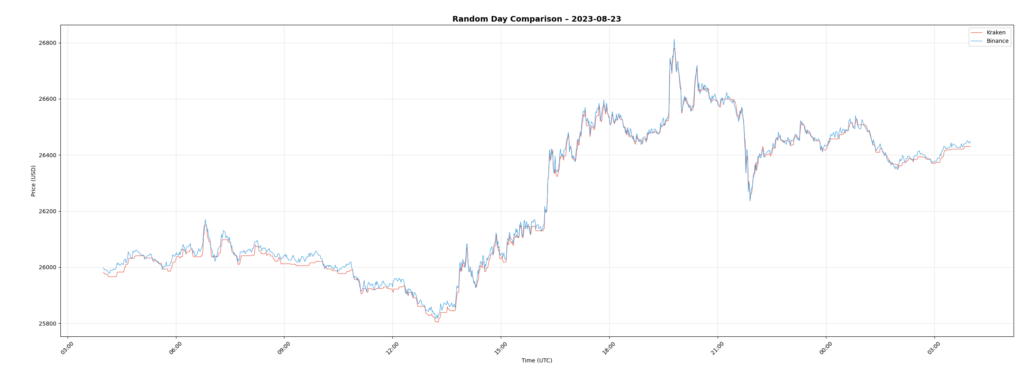
Example Day: 2023-08-23
A look at a normal trading day during 2023.
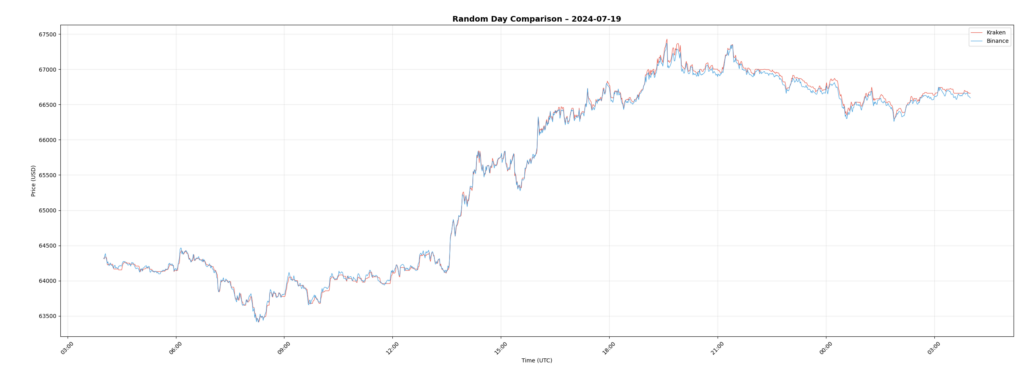
Another Sample Day: 2024-07-19
This view highlights more recent market conditions.
Historical Sample: 2018-09-25
Older data is also included for consistency checks.
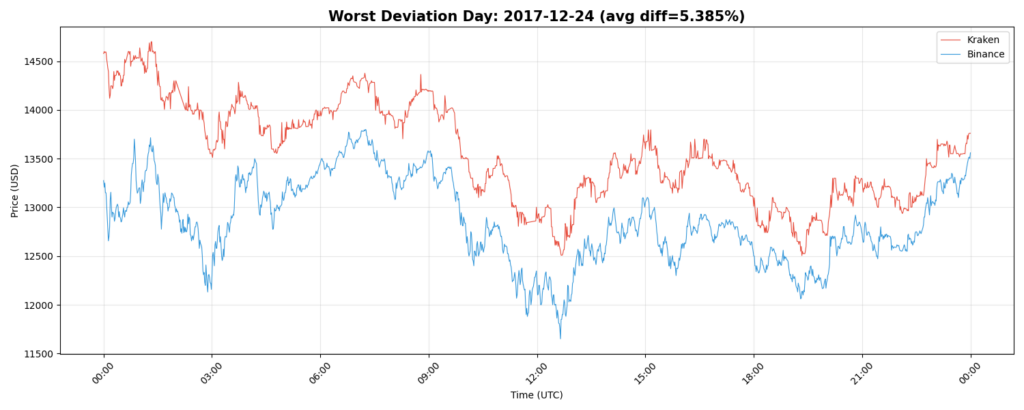
Notable Deviation: 2017-12-24
This day shows one of the more visible divergences.
Additional Deviation Example: 2018-10-15
Another instance where exchange pricing diverged temporarily.
Conclusion
Putting this dataset together takes a bit of manual downloading, but once you have the files, the process is straightforward. Kraken’s archives give you a solid foundation of intraday data, and checking it against Binance helps ensure everything is consistent. With both datasets in place, you end up with a reliable history you can use for research, validation, or any trading-related work.