
Backtesting index-based strategies requires more than historical price data and a survivorship-bias-free universe. One common and often overlooked source of bias comes from using today’s index constituents when testing strategies in the past. In reality, indices evolve continuously: stocks enter, exit, and sometimes re-enter over time.
The Problem With Using Today’s Constituents
Consider a trend-following strategy tested on the S&P 500 using only current members. This approach can materially overstate performance because today’s constituents are, by construction, the survivors. Many companies that remain in the index likely compounded strongly over past decades, while underperforming firms were removed, acquired, or delisted. Those missing names never appear in the test, even though they affected real-world results at the time.
As a result, the backtest implicitly favors companies that succeeded and excludes those that failed, creating an overly optimistic picture of historical performance.
Why this matters
Index-based backtests that rely on today’s constituents can materially overstate historical performance by excluding companies that failed or were removed from the index at the time.
Point-in-Time Index Membership Matters
To avoid this distortion, you need a point-in-time record of index membership that specifies exactly which stocks belonged to the index on each date. With this information, your backtest includes only the companies that actually made up the index at that moment in history.
This requirement goes beyond simply handling delisted stocks. It demands accurate historical membership data that captures additions, removals, and re-entries over time.
Related article
In a previous article, How to Construct a Survivorship Bias-Free Database in Norgate Using Python , we showed how to build a U.S. equity dataset that includes both active and delisted stocks. However, eliminating delisting bias alone is not sufficient for index-based strategies: using today’s constituents to represent the past introduces index membership bias.
What This Article Covers
In this article, we present Python code that uses Norgate Data to retrieve all symbols that have been constituents of a specified equity index (such as the S&P 500, Russell 3000, or Nasdaq 100). The workflow captures:
- Entry dates
- Exit dates
- Multiple re-entries, since some stocks enter and leave an index more than once
What You Will Learn
By the end of this tutorial, you will be able to:
- Retrieve historical point-in-time index membership data using Python and Norgate Data
- Identify when a stock entered, exited, and re-entered a major index
- Construct a survivorship bias-free index constituency table suitable for backtesting
To ensure reproducibility, we provide a complete Python workflow that users can run locally and adapt easily to different indices, time ranges, and research requirements.
Output Example
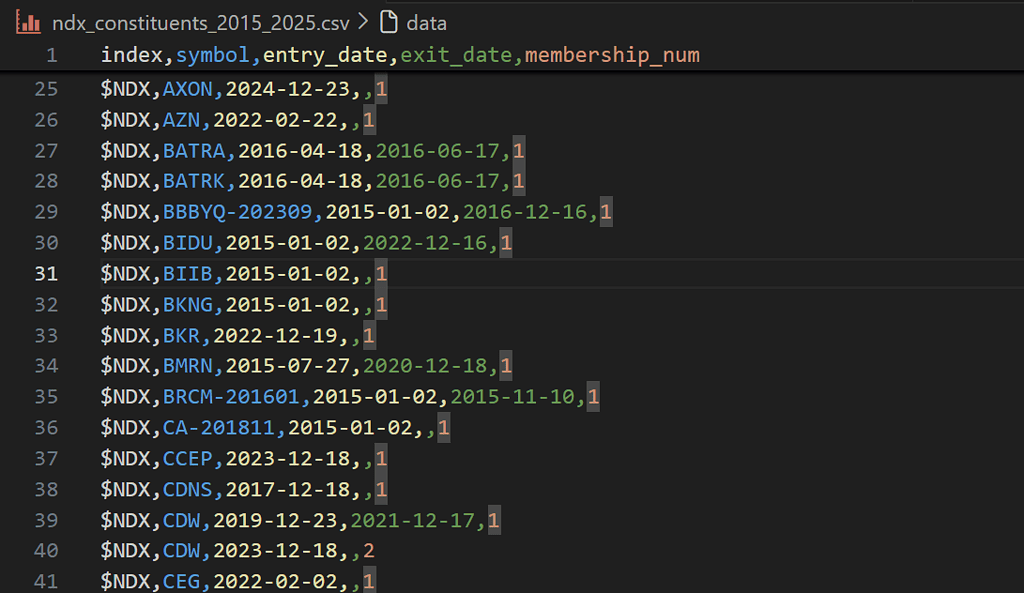
Output Columns
| Header | Explanation |
index | Index identifier from Norgate Data (e.g., $NDX for NASDAQ-100, $SPX for S&P 500). |
symbol | Norgate Data symbol representing the security. This may include historical suffixes for renamed or restructured companies (e.g., AABA-201910). |
entry_date | Date the symbol entered the index during the specified window. |
exit_date | Last trading day the symbol was included in the index. |
memebership_num | Sequential membership count for the symbol within the index. 1 = first inclusion, 2 = second inclusion, etc. |
Download the code and Run locally
Setting Up Norgate Data
Before diving into the code, set up Norgate Data correctly for use with Python.
- Create a Norgate Data account
Norgate offers a 21-day free trial with access to two years of historical data. - Install Norgate Data Updater
Download and install the Norgate Data Updater. This application connects to Norgate’s servers and must be running in the background for the Python API to work.

Ensure Required Databases Are Active
After installing the Norgate Data Updater, download the required databases and mark them as active before using the Python API.
In the Norgate Data Updater, navigate to the Database section and verify that the following databases are active:
- US Equities
- US Equities Delisted
- US Indices

If any of these databases are missing or inactive, select them and click Download. Confirm they are fully active before proceeding with the Python integration.
We are not affiliated with or sponsored by Norgate Data, nor are we compensated for this article. Norgate Data is used purely as a reliable source for historical market and index membership data.
Let’s Get Started
With Norgate Data installed, the required databases active, and the updater running in the background, we’re ready to begin.
We’ll start by configuring the indices and date range to analyze, then build a Python workflow that scans all active and delisted U.S. equities to reconstruct their full index membership history. The process produces a point-in-time index constituency table that you can use directly in survivorship bias-free backtests and research.
Step 1: Configuration
We start by defining the indices to analyze and the historical date range. This step determines the scope of the scan and identifies index entry and exit events.
The process treats stocks that were members before the start date as pre-existing constituents and assigns explicit entry dates to additions during the window.
import norgatedata
import pandas as pd
from datetime import datetime

INDICES = ['$NDX', '$SPX']      # NASDAQ 100, S&P 500
START_DATE = '2015-01-01'
END_DATE = '2025-12-17'

start = datetime.strptime(START_DATE, '%Y-%m-%d').date()
end = datetime.strptime(END_DATE, '%Y-%m-%d').date()

print(f"Indices: {INDICES} | Window: {START_DATE} to {END_DATE}")
How to Find the Correct Index Codes
Norgate uses specific symbol codes for indices (e.g. $NDX for the NASDAQ 100, $SPX for the S&P 500). To find the correct code for any index, you can use the Norgate Data Viewer.
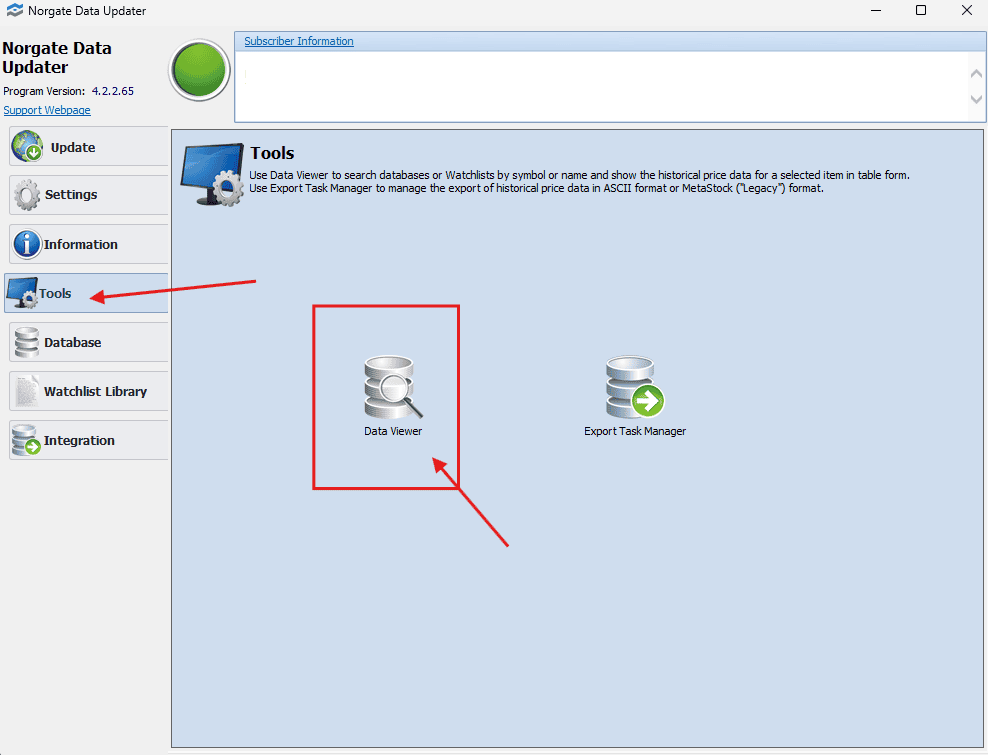
From the Norgate Data Updater:
- Open Tools
- Launch Data Viewer
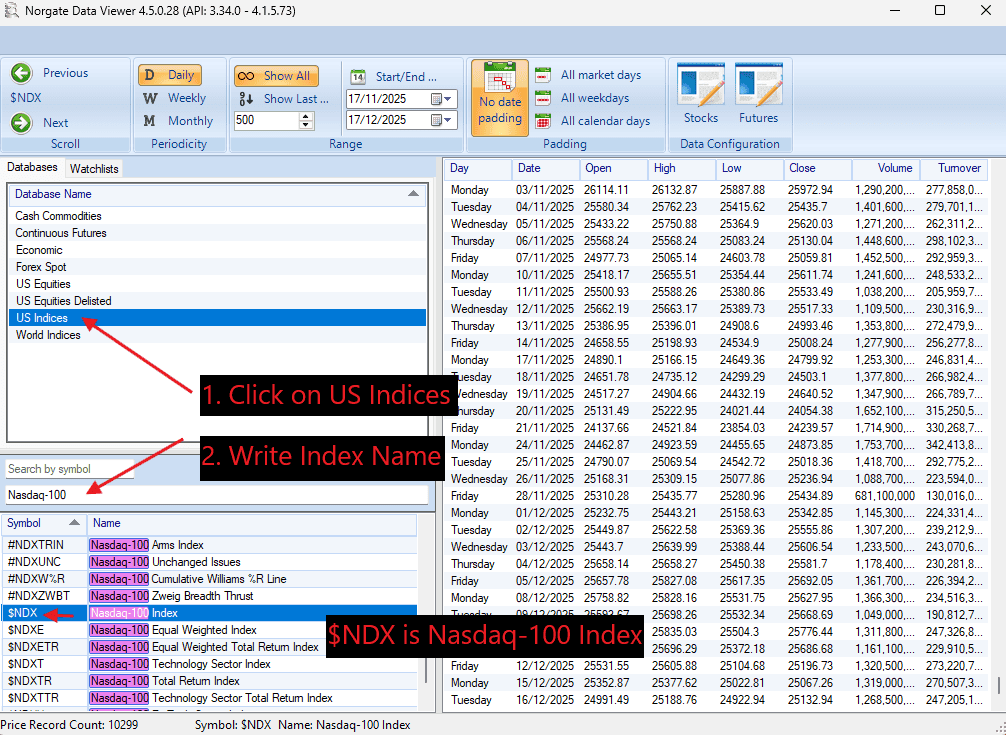
In the Data Viewer:
- Select US Indices
- Type the index name (e.g. Nasdaq-100)
- Use the displayed Symbol value (e.g.
$NDX) in your Python code
This ensures you are using the exact index identifiers expected by the Norgate Python API.
Step 2: Build the Symbol Universe
To reconstruct historical index membership correctly, we must scan all U.S. equities, including both active and delisted stocks. Restricting the universe to currently active symbols would reintroduce survivorship bias.
Using Norgate Data, we retrieve symbols from the US Equities and US Equities Delisted databases and combine them into a single universe.
# Retrieve active and delisted U.S. equity symbols
active = norgatedata.database_symbols('US Equities')
delisted = norgatedata.database_symbols('US Equities Delisted')

all_symbols = list(set(active + delisted))
print(f"Total symbols to scan: {len(all_symbols):,}")
This symbol universe will be used in the next step to detect index membership spells for each stock across the selected indices and date range.
Step 3: Detect Index Membership Spells
Index membership is not static. A stock can be added, removed, and later re-added to the same index. To capture this behavior, we track membership spells, continuous periods during which a stock is part of an index.
For each symbol–index pair, we retrieve the index constituent time series from Norgate Data and scan it sequentially. When a stock enters the index, a new spell begins. When it leaves, the spell ends on the last day the stock was still in the index, not the first day it drops out.
Pre-existing members at the start of the analysis window are handled explicitly by leaving the entry date undefined, while re-entries are tracked using a membership counter.
def get_membership_spells(symbol: str, index: str, start, end) -> list[dict]:
    """
    Extract index membership spells for a single symbol.
    exit_date = last day the stock was in the index.
    """
    ts = norgatedata.index_constituent_timeseries(
        symbol,
        index,
        start_date=start,
        end_date=end,
        timeseriesformat='pandas-dataframe'
    )

    if ts is None or ts.empty or ts['Index Constituent'].max() == 0:
        return []

    spells, in_index, entry_dt, mem_num = [], False, None, 0
    last_in_date = None
    is_actual_entry = False

    for dt, val in ts['Index Constituent'].items():
        dt = pd.Timestamp(dt).date()

        if val == 1 and not in_index:
            in_index = True
            mem_num += 1
            entry_dt = dt
            last_in_date = dt
            is_actual_entry = (dt != start)

        elif val == 1 and in_index:
            last_in_date = dt

        elif val == 0 and in_index:
            in_index = False
            spells.append({
                'index': index,
                'symbol': symbol,
                'entry_date': entry_dt if is_actual_entry else None,
                'exit_date': last_in_date,
                'membership_num': mem_num
            })

    if in_index:
        spells.append({
            'index': index,
            'symbol': symbol,
            'entry_date': entry_dt if is_actual_entry else None,
            'exit_date': None,
            'membership_num': mem_num
        })

    return spells
This function produces one row per membership spell, capturing entry dates, exit dates, and multiple index re-entries for the same stock.
Step 4: Scan All Symbols and Indices
With the symbol universe and spell detection logic in place, we scan all symbols across the selected indices and extract membership spells for each symbol–index pair.
Performance note: Scanning tens of thousands of symbols is computationally intensive. On a typical setup, scanning approximately 40,000 symbols for a single index takes about 4–5 minutes.
all_spells = []

for index in INDICES:
    print(f"\nScanning {index}...")
    found = 0

    for i, symbol in enumerate(all_symbols):
        if (i + 1) % 1000 == 0:
            print(f"  {i+1:,}/{len(all_symbols):,} symbols scanned")

        try:
            spells = get_membership_spells(symbol, index, start, end)
            all_spells.extend(spells)
            found += len(spells)
        except:
            pass

    print(f"  {index}: {found} membership spells found")

print(f"\nTotal spells: {len(all_spells)}")
Step 5: Final Dataset and Export
Once all membership spells have been collected, we combine them into a single DataFrame and sort the results by index, symbol, and membership sequence. This produces a clean, point-in-time index constituency table.
df = pd.DataFrame(all_spells)

if len(df) > 0:
    df = df.sort_values(
        ['index', 'symbol', 'membership_num']
    ).reset_index(drop=True)
Each row in the dataset represents a single index membership spell, with clearly defined entry and exit dates.
We then export the results to a CSV file, embedding the date range in the filename for reproducibility.
prefix = '_'.join([i.replace('$', '').lower() for i in INDICES])
start_year = START_DATE[:4]
end_year = END_DATE[:4]

output_file = f"{prefix}_constituents_{start_year}_{end_year}.csv"
df.to_csv(output_file, index=False)

print(f"Saved: {output_file}")
This file can be directly joined with historical price data to construct survivorship bias-free, index-aware backtests.
Conclusion
In this article, we constructed a point-in-time index constituency database using Python and Norgate Data. By explicitly tracking index entry dates, exit dates, and multiple re-entries, we eliminate a common and often overlooked source of survivorship bias in index-based backtests.
This approach ensures that historical simulations reflect the true composition of an index at any point in time, rather than relying on today’s constituents. The resulting dataset can be directly integrated with historical price data to support more accurate backtesting, event studies, and index-related research.