
A complete Python procedure for constructing an S&P 1500 GICS database from Norgate Data.

From Individual Stocks to Entire Industries
Most quantitative equity research starts with individual securities. We download historical stock prices, construct a survivorship-bias-free universe, and test signals across hundreds or thousands of companies.
However, many portfolio managers are more interested in systematic strategies that exploit opportunities across sectors or industries rather than across individual stocks. A manager may want to rotate dynamically into the cheapest sectors, tilt exposure toward industries with the strongest momentum, exploit short-term mean reversion in diversified baskets, or apply long-horizon trend-following rules to economically coherent groups of companies.
To test these ideas properly, researchers need historical portfolios representing those groups through time. In practice, this means having consistent return series for sectors, industry groups, industries, and sub-industries, with classifications that are stable, transparent, and suitable for backtesting.
The standard framework used to organize these groups is the Global Industry Classification Standard, better known as GICS. The taxonomy assigns each company to a four-level hierarchy:
- Sector
- Industry Group
- Industry
- Sub-Industry


This classification framework has already played an important role in our research. In A Mean-Reversion Model for US Sectors, we studied short-term reversal signals across the eleven investable SPDR Sector ETFs, each designed to track a major GICS sector.
At a more granular level, our Dow Award-winning paper with Gary Antonacci, A Century of Profitable Industry Trends, examined trend following across industry portfolios over more than a century of market history. In that study, we relied on the Kenneth French industry portfolios, which provide a classification framework similar in spirit to GICS.
Both projects illustrate why historical group-level data can be extremely valuable.
They also expose a practical problem: where can an independent researcher obtain these data?
Why Sector ETFs Are Not Enough
Researchers with access to institutional platforms such as Bloomberg or LSEG Workspace can easily retrieve long historical series for sector and industry indices. For most independent researchers, however, these platforms are prohibitively expensive.
The obvious alternative is to use exchange-traded funds. Products such as SPY, IVV, and VOO provide investable exposure to the S&P 500, while sector ETFs such as XLK, XLF, XLE, and XLV track major GICS sectors.
ETFs are useful when the objective is to build a directly tradable strategy. They are less suitable as the primary source for broad historical research for two reasons:
- Their histories are limited. Many sector ETFs only begin in the late 1990s, while more specialized products have much shorter records.
- They do not cover the complete GICS hierarchy. The eleven broad sectors are well represented, but Industry Groups, Industries, and Sub-Industries are only partially covered.
As a result, ETFs cannot provide a complete historical database for studying the full economic structure of the US equity market.
The Alternative: S&P 1500 GICS Indices
Fortunately, S&P calculates a broad family of indices that divide the S&P Composite 1500 universe according to the GICS hierarchy.
The logic is similar to the S&P 500 itself. The S&P 500 is an index rather than a directly traded security. Products such as SPY, IVV, and VOO are investment vehicles designed to replicate its performance. In the same way, the S&P 1500 GICS indices are calculated benchmarks representing the performance of specific sectors, industry groups, industries, and sub-industries.
The approximately 1,500 companies in the S&P Composite 1500 are assigned to their respective GICS categories. S&P then calculates the historical Open, High, Low, and Close values for each group-level index through time.
Why This Matters
Rather than downloading stock-level data, reconstructing point-in-time index memberships, aggregating thousands of constituent returns, and maintaining the full GICS classification history, researchers can work directly with historical index series.
This significantly reduces the complexity and computational overhead of sector and industry research, allowing more time to focus on analysis, strategy development, and backtesting.
Norgate Data makes these historical index series available through its US Indices database and Python API. This gives independent researchers access to a large portion of the S&P 1500 GICS hierarchy without requiring Bloomberg or LSEG Workspace.
A Note on Total Return and Index OHLC Data
These indices are calculated benchmarks rather than securities traded on an exchange. Their volume is therefore generally zero, but their OHLC fields represent the calculated daily path of each index.
For backtesting purposes, the key requirement is to use the Total Return versions, which incorporate distributions into the index calculation. These series therefore contain the return information required to test systematic strategies correctly without separately adjusting for dividends.
What the Database Contains
The official GICS taxonomy contains the counts shown in Table 1 above. Those figures describe the complete classification system. They do not imply that the S&P 1500 contains companies in every category.
An index can only be calculated where the underlying universe has eligible constituents. Some narrow GICS categories may contain no S&P 1500 companies, or too few companies for a corresponding index to be available. This explains why practical coverage is slightly smaller at the most granular levels.

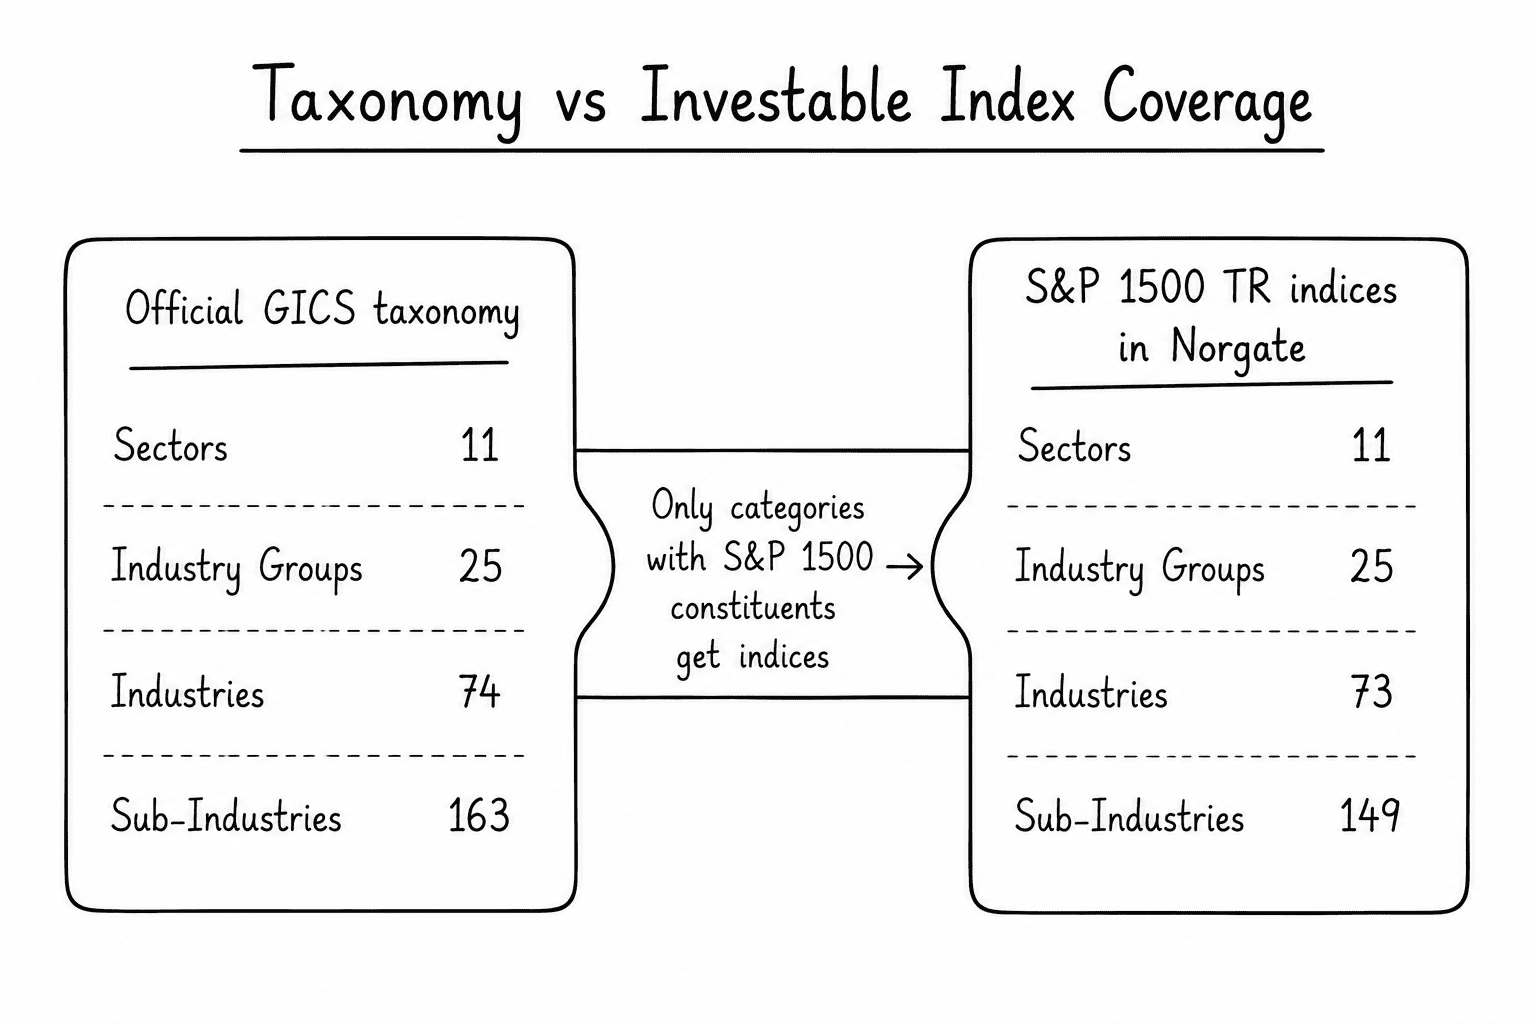
At the time of writing, the only missing Industry series is Transportation Infrastructure. The unavailable Sub-Industry series are concentrated in narrow categories such as Silver, Forest Products, Airport Services, Drug Retail, and several Real Estate Management & Development classifications.
The important point is that this is not necessarily a data-quality failure. It is largely a consequence of applying the full global GICS taxonomy to the narrower S&P 1500 constituent universe.
A Simple Procedure for Building the Database
From the user’s perspective, the workflow is intentionally simple:
- Open the Norgate Data Updater and keep it running.
- Activate and download the US Indices database.
- Open the supplied Jupyter notebook.
- Select the desired date range and output folder.
- Run all cells.
Note
Currently, Norgate Data only supports Python on Windows, as stated in their official documentation.
The notebook then discovers the relevant symbols, identifies the correct Total Return series, assigns each index to its GICS level, downloads the complete history, validates the resulting universe, and exports the data automatically.

The final output consists of four Parquet files and one combined CSV file:


Each Parquet file uses the same long-panel structure:

Names also encode the GICS level directly:

Typical dataset shapes:

For Technical Readers: What the Python Pipeline Does
The simple workflow above hides several non-obvious implementation issues. The technical section below explains the safeguards built into the notebook.

1. Symbol Discovery
The workflow first scans Norgate’s US Indices database for symbols beginning with $SP1500. A preliminary filter retains candidates whose tickers end in TR.
That ticker rule is not sufficient on its own. Some price-only indices happen to end with the letters TR because those letters are part of the underlying classification name. The notebook therefore checks that the full security name explicitly contains Total Return.
It also excludes broad parent indices such as:
$SP1500TR, S&P 1500 Total Return Index$SP1500EWTR, S&P 1500 Equal Weight Total Return Index
These are valid indices, but they are not individual GICS tiers and therefore do not belong in the sector-and-industry panel.


2. Classification by Security Name
The notebook classifies each surviving symbol using the naming convention in Norgate’s Name field:

This is more robust than inferring hierarchy levels from ticker suffixes alone.
3. Independent Sector-Mapping Check
As an additional sanity check, the notebook uses Norgate’s corresponding_industry_index() helper on one representative company from each sector.
For example, XOM should map to the S&P 1500 Energy Sector Total Return index ($SP1500ETR), AAPL to Information Technology ($SP1500TTR), JPM to Financials ($SP1500FTR), and AMT to Real Estate ($SP1500RTR).

This cross-check does not replace the full database scan. Its purpose is to confirm that the live stock-to-sector mappings resolve to the expected indices.
4. Validation Against the Official Taxonomy
Once classification is complete, the notebook compares the number of downloaded indices with the official GICS counts.
The two upper levels are required to match exactly:
- 11 Sectors
- 25 Industry Groups
The Industry and Sub-Industry levels may be below 74 and 163 because some categories are not represented within the S&P 1500. Rather than forcing an incorrect match, the code reports the missing categories explicitly.

5. Standardized Panel Output
Each Parquet file uses the same long-panel structure shown in Table 4. Parquet is particularly convenient for this application because it preserves data types, compresses efficiently, and can be read quickly from Python, MATLAB, R, or other research environments.
What Researchers Can Build with These Data
Once assembled, the database becomes a reusable research layer rather than a one-off download.
Potential applications include:
- Time-series trend following across sectors and industries
- Cross-sectional industry momentum
- Short-term sector and industry mean reversion
- Relative-strength and rotation models
- Dispersion studies across different levels of the GICS hierarchy
Researchers should nevertheless distinguish between benchmark research and tradable implementation. The S&P 1500 GICS indices provide clean historical benchmarks, but many of them are not directly investable.
At the broad sector level, implementation is relatively straightforward because liquid ETFs are widely available. At the Industry and Sub-Industry levels, retail investors may struggle to find suitable tradable vehicles. Institutional investors have more options, including custom baskets, swaps, and bank-sponsored thematic portfolios, although these solutions can be expensive and may introduce additional implementation frictions.
Conclusion
Testing strategies across sectors and industries should not require rebuilding hundreds of historical portfolios from individual stocks.
Norgate Data provides access to the calculated S&P 1500 GICS Total Return indices, allowing researchers to work directly with long historical series for sectors, industry groups, industries, and sub-industries. The notebook shared with this article turns that raw universe into standardized, validated, research-ready Parquet files.
The practical advantages are substantial: no manual symbol collection, no stock-level aggregation, no need to reconstruct the complete hierarchy from scratch, and a consistent schema that can be reused across multiple projects.
For an example at the broadest GICS level, see A Mean-Reversion Model for US Sectors. For a longer-horizon application at the industry level, see our Dow Award-winning study with Gary Antonacci, A Century of Profitable Industry Trends.
Download the Notebook
Use the complete Python pipeline to discover, classify, validate, and export the available S&P 1500 GICS Total Return indices from Norgate Data.

Disclaimer
This publication is provided by Concretum Group for informational, educational, and research purposes only. It does not constitute investment, financial, legal, or tax advice, nor a recommendation to buy or sell any security, instrument, strategy, or investment product. All investments involve risk, including possible loss of principal. Past performance, backtested performance, and historical analysis are not reliable indicators of future results.
We are not affiliated with or sponsored by Norgate Data, nor are we compensated for this article. Norgate Data is referenced solely as a data source for historical S&P 1500 index data.
GICS® is a registered trademark of MSCI and S&P Dow Jones Indices. This article is not affiliated with or endorsed by MSCI or S&P Dow Jones Indices.
Full disclaimer: https://concretumgroup.com/disclaimer/
