
Can Investors Anticipate Institutional Portfolio Rebalancing?
Nowadays, hardly a day goes by without hearing the word “flow” in financial news or market commentary: whether it’s record inflows into the hottest leveraged single-stock ETF or outflows from more neglected corners of the market… it’s a concept we’ve all grown accustomed to.
Unsurprisingly, the idea that meaningful amounts of capital are continuously moving in and out of asset classes has long attracted academic attention, with researchers investigating whether these flows carry useful information for predicting future returns (see, e.g., Frazzini and Lamont, 2008; Lou, 2012).
Today, drawing on the valuable work of Harvey, Mazzoleni and Melone in their 2025 paper, “The Unintended Consequences of Rebalancing”, we thought it would be interesting to explore a simple trading strategy based on the authors’ key findings.
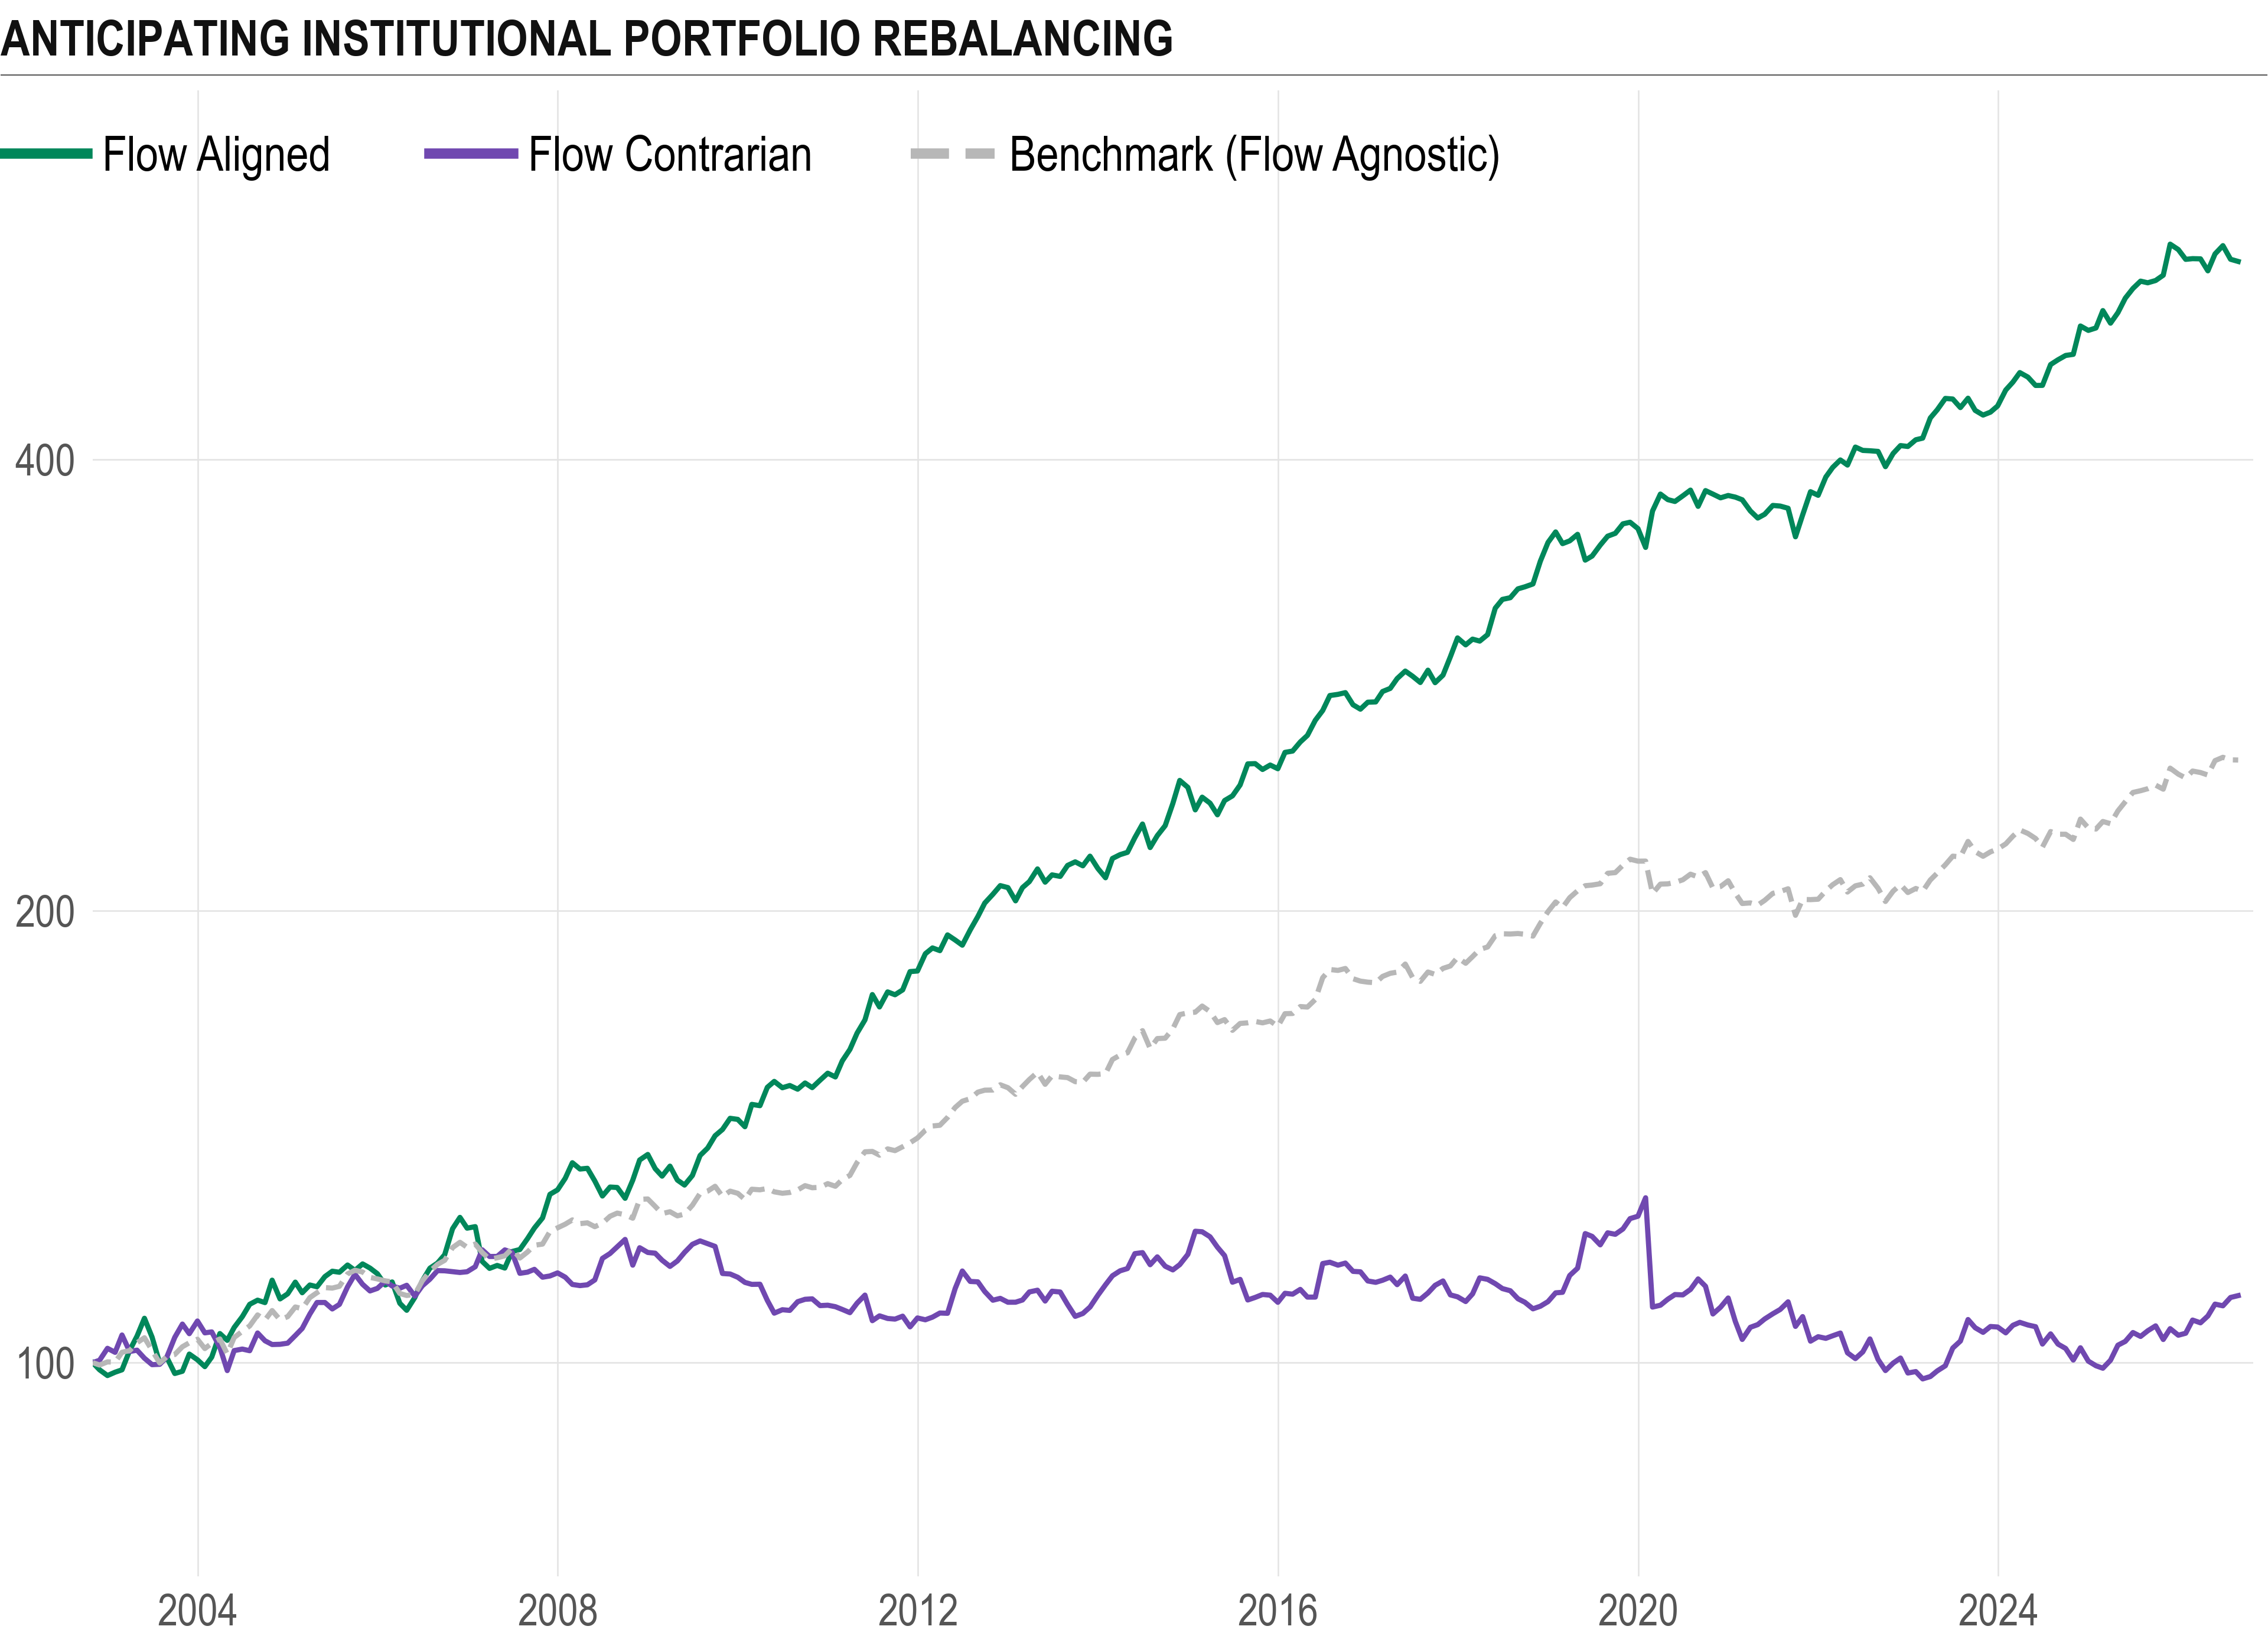
We were pleased to find that, despite the framework’s simplicity, the strategy remained attractive even after accounting for conservative transaction costs, delivering a CAGR of 7.3% and a Sharpe ratio of ~1, all while keeping average capital usage well below 30%.
In the following sections, we examine the economic rationale behind the results and show how this simple rebalance-flow trade can be implemented using liquid ETFs.
Go With the Flow…
As more experienced quants will know, one particularly valuable skill is being able to identify markets where certain participants are (in a sense) forced to trade in a given direction.
This may sound counterintuitive at first, but not every investor is driven by the need to uncover new sources of alpha or outperform a benchmark.
A meaningful part of the asset-management industry instead operates within strict mandates and policies. Consider, for example, pension, sovereign-wealth, and mutual funds that maintain balanced stock-and-bond portfolios, of which the traditional 60/40 is likely the most popular expression.
These institutions, which collectively manage trillions of dollars, are expected to maintain and strictly adhere to the allocations specified in their mandates.
In the case of a 60/40 portfolio, this means holding approximately 60% in stocks and 40% in bonds and, as market movements pull those weights away from their targets, periodically bringing the portfolio back to its ideal allocation.
Therefore, when equities outperform, many managers become “forced” buyers of bonds and sellers of stocks, and vice versa; hence, their trading is not driven by new views on trends, valuations, or growth expectations, but simply by the need to bring the portfolio back in line with its target weights.
Now, if knowing where to find “forced” market participants is important, knowing when they are most likely to trade is even more valuable.
With both pieces of information, we could position ahead of predictable, price-insensitive flows and (provided we correctly anticipate their direction) allow the subsequent rebalancing activity to push prices in our favor.
Crucially, Harvey, Mazzoleni, and Melone (2025) suggest that the flows generated by stock-and-bond rebalancing practices tend to cluster around month-end, making both their direction and timing partly predictable: as the authors note, “calendar predictability peaks in the last four days of the month.”
Some Tests
Motivated by the idea that these month-end flows are both predictable and large enough to influence prices, we conduct a simple test using two popular vehicles: the SPDR S&P 500 ETF Trust (SPY) and the iShares 20+ Year Treasury Bond ETF (TLT), which serve as accessible proxies for equity and bond exposure.
The first question is whether the relative performance of stocks and bonds earlier in the month helps predict their relative performance near month-end.
If rebalancing flows matter, strong equity performance should leave balanced portfolios overweight stocks, creating pressure to sell equities and buy bonds. In that case, we would expect TLT to outperform SPY into month-end (with the opposite occurring after strong bond outperformance).
To test this, we compare SPY and TLT returns over two parts of each month. The explanatory variable (X) is the SPY-minus-TLT return up to a chosen point (T-N) before month-end (T). Instead, the dependent variable (Y) is the same return differential measured over the remaining trading days of the month.

Accordingly, for each horizon N, we simply estimate:
A negative β is consistent with the presence of rebalancing-flow effects: when SPY outperforms TLT before the observation date (T−N), TLT tends to outperform SPY afterward, and vice versa.

These results appear economically coherent with the phenomenon identified in the Harvey-Mazzoleni-Melone paper.
Judging from both R2 and p-values, relative stock-and-bond performance reverses more clearly in windows near month-end, consistent with the presence of large rebalancing flows having meaningful impact on prices around those days.
Building a Strategy
As always, one thing is to identify a market effect and another is to design a strategy around it. This is why we now focus on what we view as an appropriate implementation of this idea, covering signal generation, position sizing and execution.
Premium article
Read the full article
Buy this article on its own, or subscribe on Substack to read it together with all our premium research.
Questions about buying or your order? Email [email protected]